
Annual Report Infographics
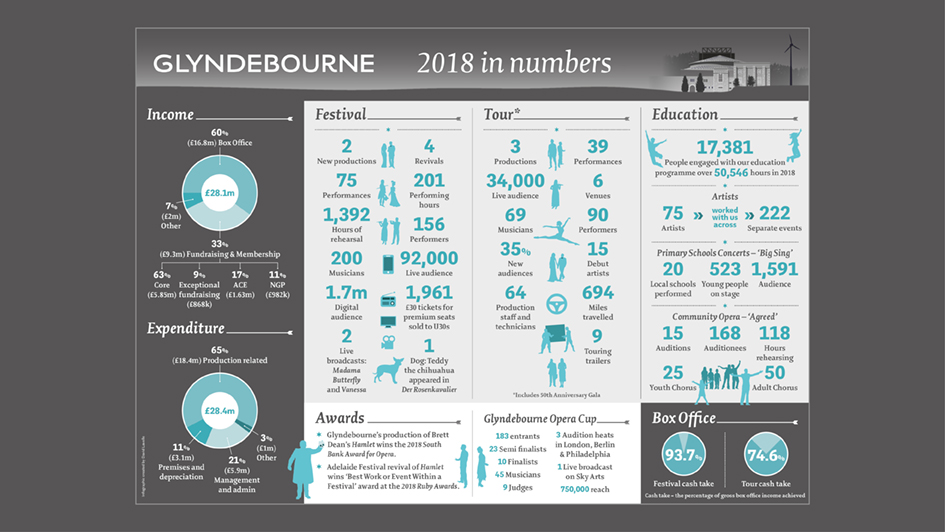
Report: “2018 in numbers” infographics.
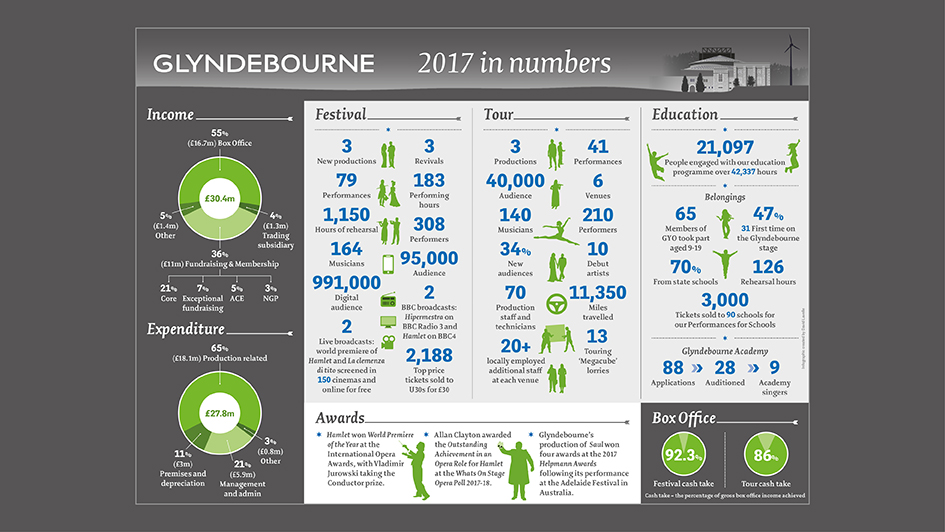
Report: “2017 in numbers” infographics.
Selected facts and figures for the Glyndebourne annual report. The graphics were included on a single page in the document, which was published exclusively online.
Membership Infographics 2017
Illustration of the Concert Hall and House for a set of infographics.
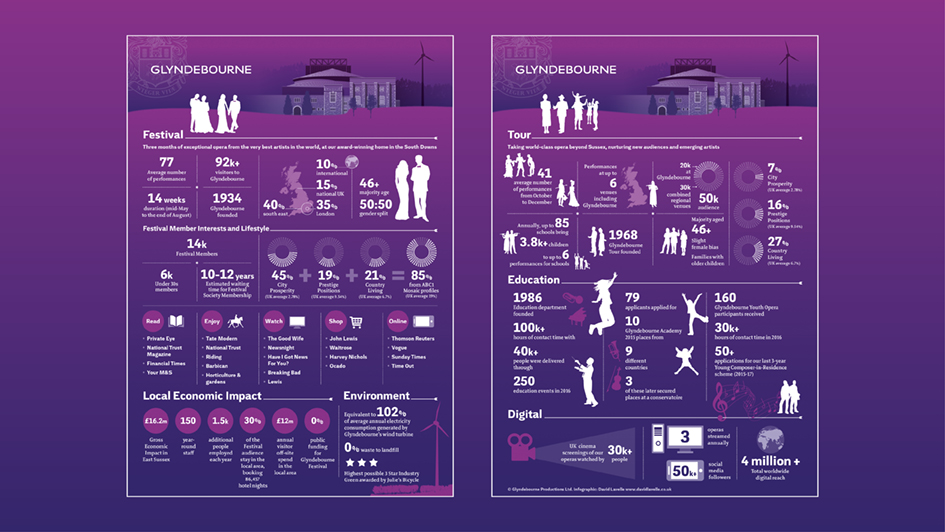
Double-sided A4 insert.
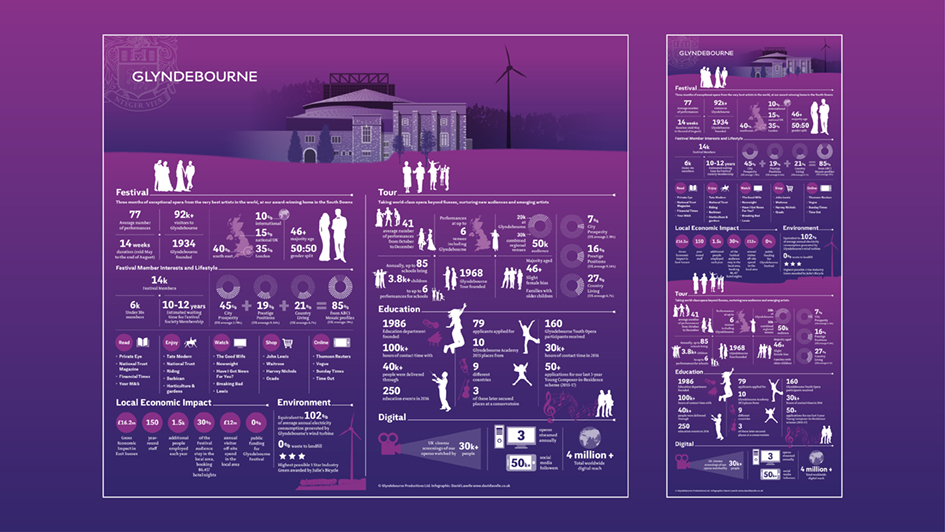
Repurposed into two orientations for digital use.
Infographics 2014
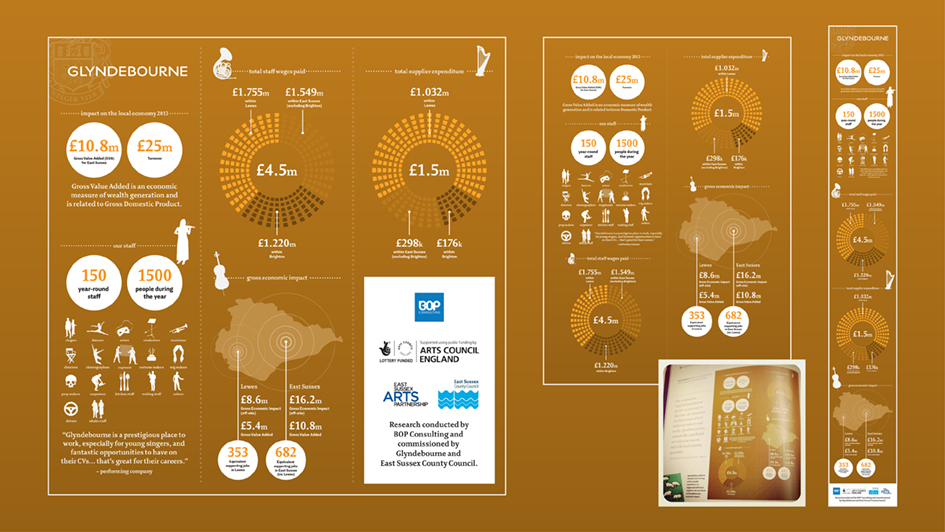
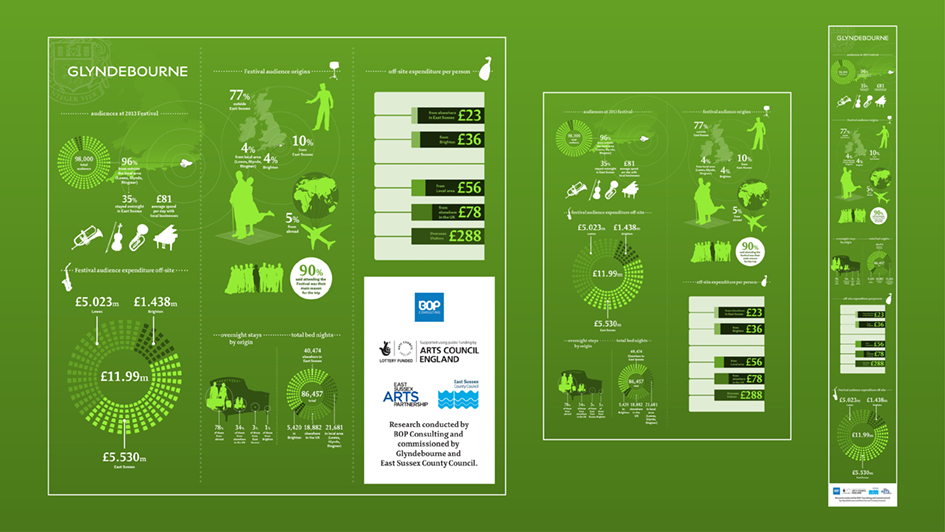
Created for a report in 2014, authored by Glyndebourne Productions Ltd and East Sussex County Council. The artwork was later featured in Glyndebourne’s 2014 Festival Brochure.
© Glyndebourne Productions Ltd.